Global Sea Level Rise Google Mashup + Possible new sea levels!
Thanks to Dave Sag of Carbon Planet for this superb link.
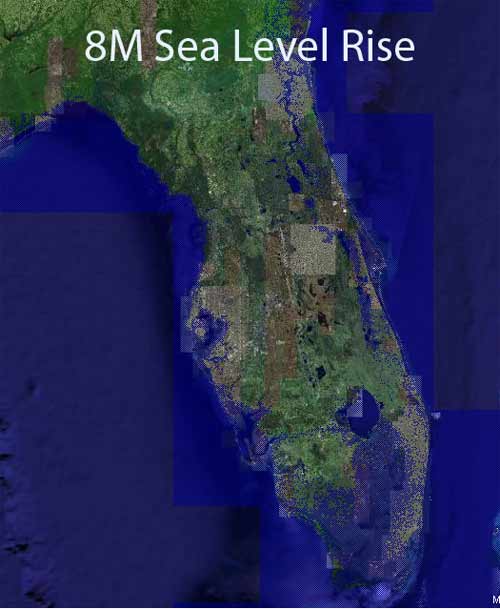
This is a google 'mash-up' that allows you to alter sea level from 0-12m throughout the globe and then zoom in on your part of the planet and sea the new coastline.


Now, there is a huge degree of uncertainty about how much sea level rise we are going to see. In the TAR the IPCC produce a conservative range of changes over the next century from 40cm to just over a meter. On the other hand, RealClimate, the well respected climate change blog run by scientists tells us that the models on which these results where based where to simplistic and recent evidence has higlighted this starkly. Ice sheets had been treated as solid masses with few dynamics, now we see that in greenland where the icecap has started to melt rapidly that the ice is disintigrating, fragments are forming as surface streams penetrate through the ice and lubricate its motion.
With 2-3 degrees of climate change globally the greenland ice sheet was predicted to be severely threatend but the loss of this is was thought to be an extremely slow process taking mellenia, now the situations seems to me moving faster than we might like.
In a recent article in the New York Times Book Review, Jim Hansen of NASA's Goddard Space Institute points out asks how much sea level rise we can expect with 'business as usuall' emmissions scenarios:
With this map--which you can zoon in on anywhere on earth--it makes this next project even easier...and it gives you a great resource for posters and other materials.
 So if we know how what a sea level rise of say 7m's (the result of the greenland ice sheet melting), would look like, don't you think that this is worth sharing?
Here is the introduction to a blog by a climate change activists in SF.
Joel is not the only one marking off potential new sea levels, there is a whole project behind this idea and i`m sure it wont be long before the idea spreads.
Home

 del.icio.us

 Digg This!


This is a google 'mash-up' that allows you to alter sea level from 0-12m throughout the globe and then zoom in on your part of the planet and sea the new coastline.

Now, there is a huge degree of uncertainty about how much sea level rise we are going to see. In the TAR the IPCC produce a conservative range of changes over the next century from 40cm to just over a meter. On the other hand, RealClimate, the well respected climate change blog run by scientists tells us that the models on which these results where based where to simplistic and recent evidence has higlighted this starkly. Ice sheets had been treated as solid masses with few dynamics, now we see that in greenland where the icecap has started to melt rapidly that the ice is disintigrating, fragments are forming as surface streams penetrate through the ice and lubricate its motion.
With 2-3 degrees of climate change globally the greenland ice sheet was predicted to be severely threatend but the loss of this is was thought to be an extremely slow process taking mellenia, now the situations seems to me moving faster than we might like.
In a recent article in the New York Times Book Review, Jim Hansen of NASA's Goddard Space Institute points out asks how much sea level rise we can expect with 'business as usuall' emmissions scenarios:
How much will sea level rise with five degrees of global warming? Here
too, our best information comes from the Earth's history. The last time that the
Earth was five degrees warmer was three million years ago, when sea level was
about eighty feet higher.
Eighty feet! In that case, the United States would lose most East
Coast cities: Boston, New York, Philadelphia, Washington, and Miami; indeed,
practically the entire state of Florida would be under water. Fifty million
people in the US live below that sea level. Other places would fare worse. China
would have 250 million displaced persons. Bangladesh would produce 120 million
refugees, practically the entire nation. India would lose the land of 150
million people.
With this map--which you can zoon in on anywhere on earth--it makes this next project even easier...and it gives you a great resource for posters and other materials.
So if we know how what a sea level rise of say 7m's (the result of the greenland ice sheet melting), would look like, don't you think that this is worth sharing?Here is the introduction to a blog by a climate change activists in SF.
Hi. My name is Joel and I live on Earth in a coastal city called San
Francisco. Coastal cities are cities with shorelines. Shorelines come,
shorelines go. C'mon along as we tape off some possible new shorelines in
coastal cities all around the world, with bright blue tape!
Joel is not the only one marking off potential new sea levels, there is a whole project behind this idea and i`m sure it wont be long before the idea spreads.
Labels: ecological impacts
Home
posted by Calvin Jones @ 4:37 PM
1 comments
![]()
![]()


1 Comments:
This is mostly just flashy speculation and not hard truth.
From the NASA SRTM documentation: Relative vertical accuracy (point-to-point): 90% L.E. MSL <= 12 meters over a 1° cell for low and medium relief terrain (0 to 20% predominant slope).
12 meters! And think 10% of the data will have errors larger than that.
There simply are no existing data sets with global coverage that have accuracy down to the level of a few meters. Further, different data sets (such as SRTM vs ETOPO2) give substantially different results when you try to draw new shorelines for changes of only a few meters.
The basic fact is that while we can find the current shorelines easily enough, it is largely beyond present capabilities to look 10 km inland and tell from orbit whether a piece of land is at 2m above sea level or 4m.
Hence producing truly accurate sea level rise map, at the scales actually predicted for sea level change, is a task that is beyond us at the present time (except for some geographically limited areas that have been carefully mapped from the ground).
So while these maps can offer entertaining speculation, they should not be mistaken for firm predictions of how coastlines which change as a result of sea level rise.
Post a Comment
<< Home